
Research results
Seven open research models across X-ray, CT, MRI and mammogram, trained on public data, for education and research.
Research results on public test data. They say nothing about your own scan.
The seven models
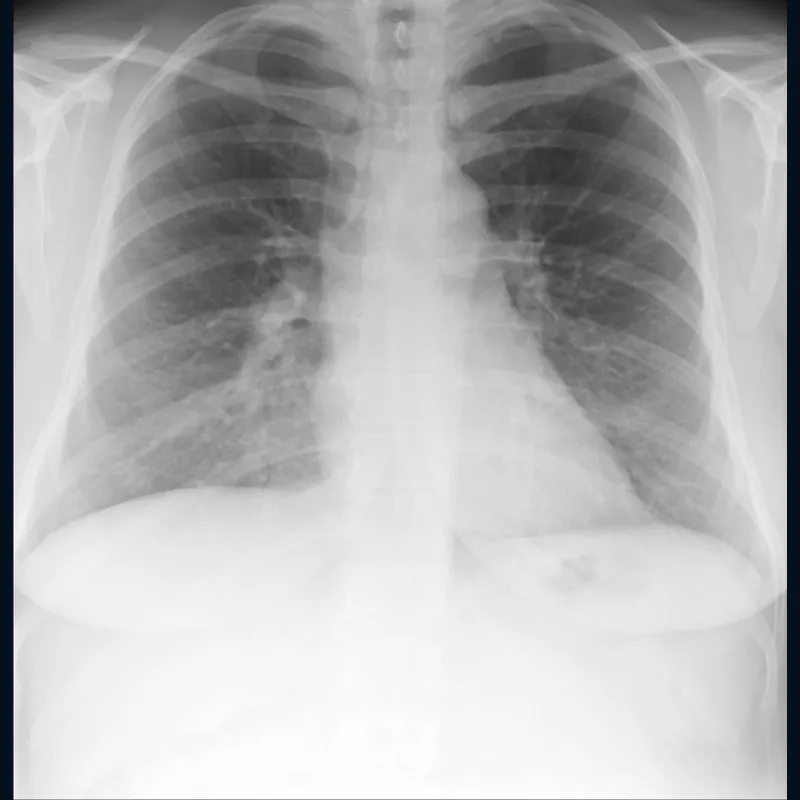 X-ray
X-rayChest X-ray research model
0.8175 (0.8110 to 0.8231)
AUROC: Agreement with ChestX-ray14's labels, mean over its 14 label types
NIH's official test list: 25,596 pictures of 2,797 patients
Held-out test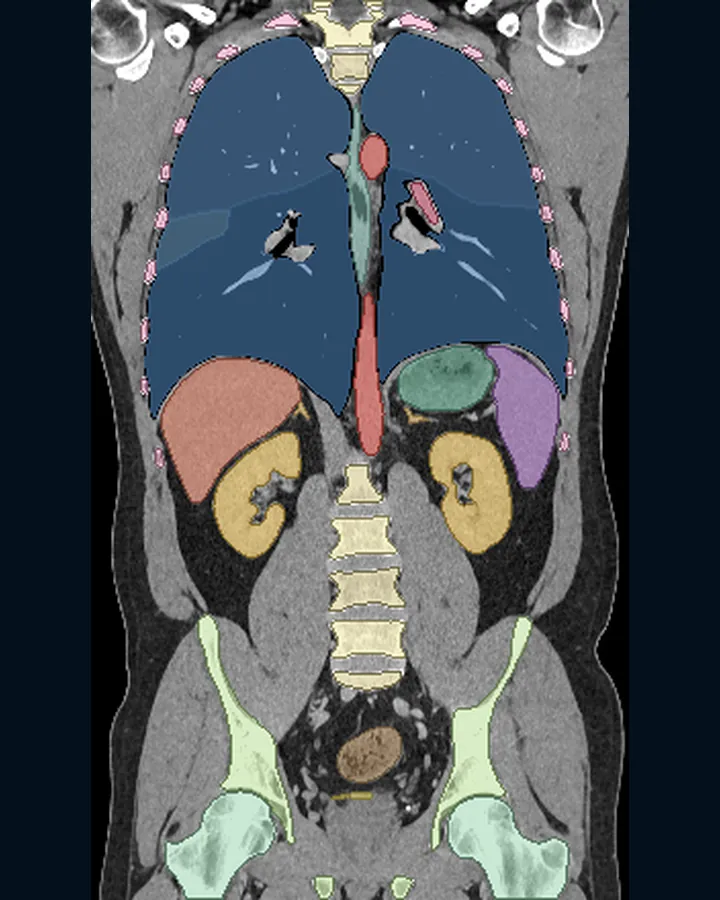 CT
CTCT organ outliner
0.8668 (0.8538 to 0.8781)
Dice: Mean over 115 structures
Held-out test: 89 CT scans
Held-out test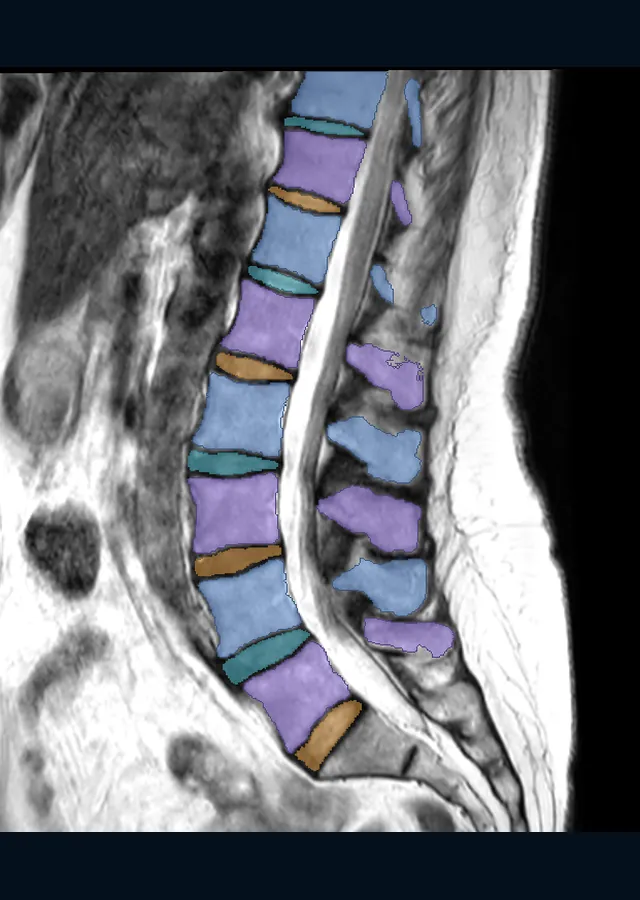 MRI
MRIDisc grading research model (MRI)
0.773 (0.664 to 0.853)
Kappa: Agreement with SPIDER's Pfirrmann grades, held-out test
SPIDER held-out test: 44 patients, 264 discs, opened once
Held-out test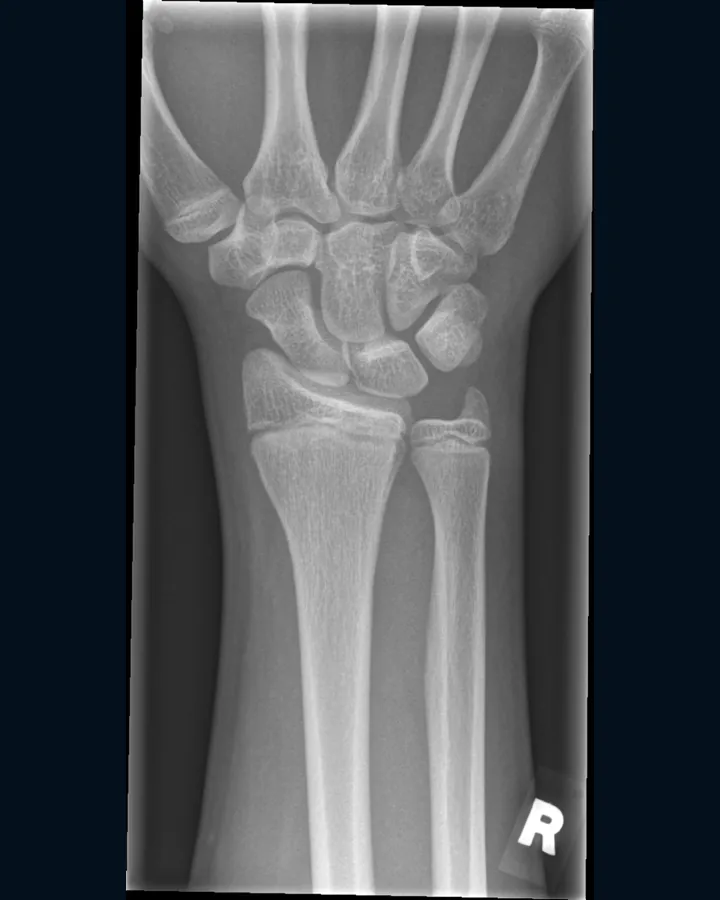 X-ray
X-rayFracture research model (X-ray)
0.979 (0.974 to 0.984)
AUROC: Agreement with GRAZPEDWRI-DX's fracture labels, children's wrists
GRAZPEDWRI-DX held-out test: 4,067 pictures of 1,176 patients with a certain label
Held-out test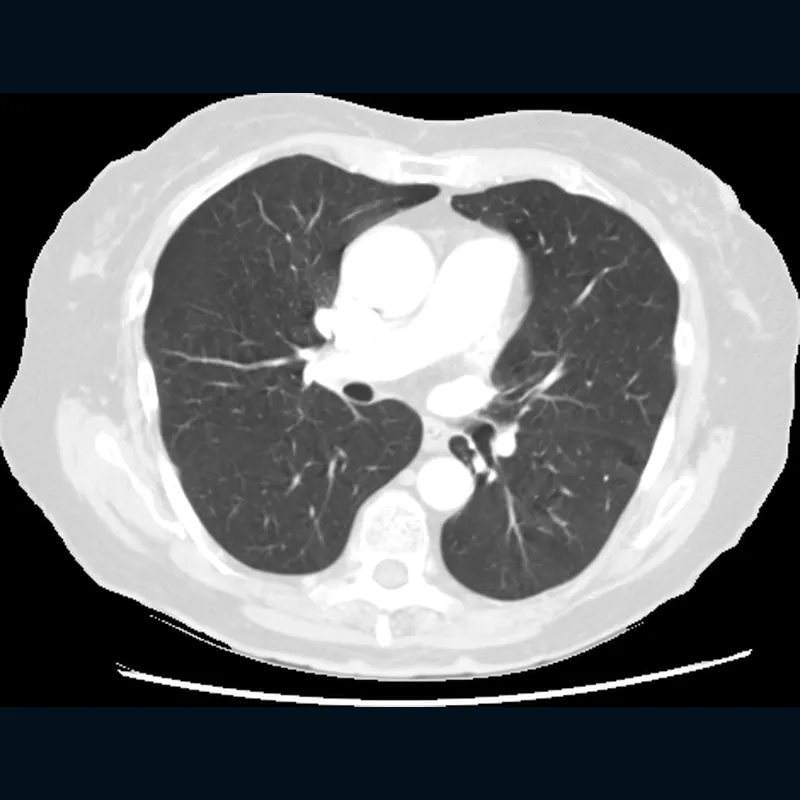 CT
CTLung nodule research model (CT)
88.0% (86.0 to 89.6%)
Share of LUNA16's marked nodules matched, averaged over seven false-alarm allowances
LUNA16: 888 thin-slice LIDC-IDRI scans, five folds, each read by a model that never trained on it
Development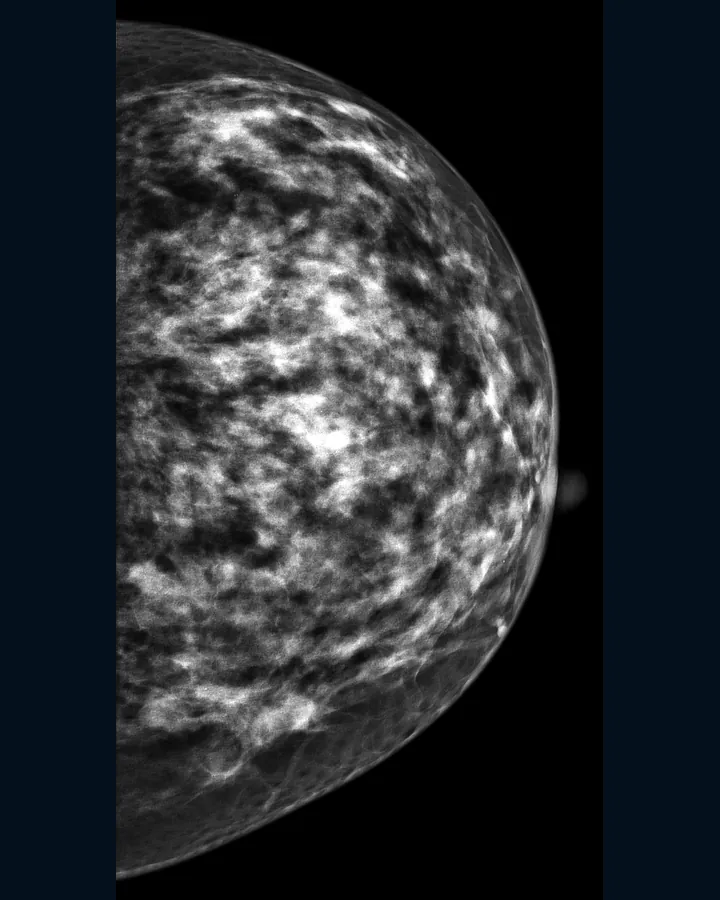 Mammogram
Mammogram research model
0.793 (0.774 to 0.811)
AUROC: Agreement with CMMD's benign/malignant labels, per picture
CMMD: 3,744 pictures of 1,775 patients, five folds split by patient
Development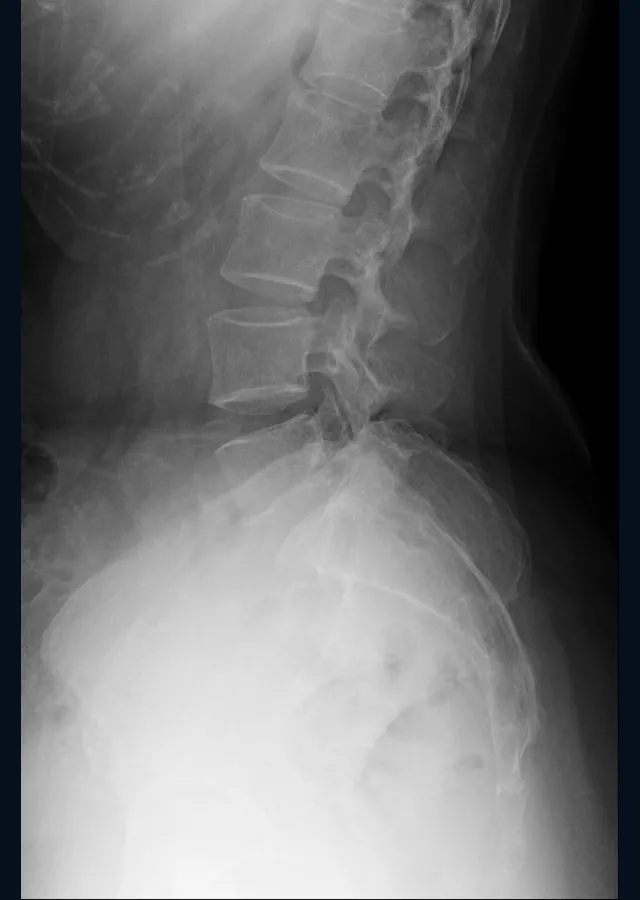 X-ray
X-rayLumbar spine X-ray corner reader
97.9% (97.3 to 98.4%)
Share of BUU-LSPINE's marked vertebrae matched, side view (IoU 0.5)
All 2,000 BUU-LSPINE patients, out of fold
DevelopmentX-ray
Chest X-ray research model
A team of ten networks trained to give 15 scores for one frontal chest X-ray, one for each of the 14 NIH ChestX-ray14 label types and one for its abnormal label.
Main results
AUROC 0.5 is a coin toss, 1 is perfect
Score (95% interval)
Held-out test
Agreement with ChestX-ray14's labels, mean over its 14 label typesNIH's official test list: 25,596 pictures of 2,797 patients
0.8175 (0.8110 to 0.8231)
Agreement with ChestX-ray14's abnormal labelNIH's official test list: 25,596 pictures
0.7363 (0.7241 to 0.7477)
Agreement with ChestX-ray14's labels, per label type
Test set: NIH's official test list, 25,596 pictures
AUROC 0.5 is a coin toss, 1 is perfect
Score (95% interval)
Held-out test
Atelectasis3,279 pictures
0.7747 (0.7622 to 0.7878)
Cardiomegaly1,069 pictures
0.9016 (0.8864 to 0.9142)
Effusion4,658 pictures
0.8388 (0.8282 to 0.8487)
Infiltration6,112 pictures
0.7071 (0.6961 to 0.7175)
Mass1,748 pictures
0.8235 (0.8032 to 0.8424)
Nodule1,623 pictures
0.7544 (0.7333 to 0.7743)
Pneumonia555 pictures
0.7267 (0.7021 to 0.7497)
Pneumothorax2,665 pictures
0.8614 (0.8447 to 0.8773)
Consolidation1,815 pictures
0.7610 (0.7459 to 0.7750)
Edema925 pictures
0.8542 (0.8383 to 0.8704)
Emphysema1,093 pictures
0.8960 (0.8801 to 0.9096)
Fibrosis435 pictures
0.8382 (0.8149 to 0.8608)
Pleural thickening1,143 pictures
0.7845 (0.7661 to 0.8036)
Hernia86 pictures
0.9232 (0.8776 to 0.9574)
Where it falls short
- Agreement is lower for some label types: infiltration scores 0.7071, pneumonia 0.7267 and nodule 0.7544.
- Rare label types have wide intervals. Hernia has only 86 test pictures, and its interval runs from 0.8776 to 0.9574.
- All the labelled pictures come from one hospital, so nothing shows how it behaves on other scanners, other patient groups or children.
Trained and tested on
- NIH ChestX-ray14 NIH asks for credit; use is unrestricted
- TAIX-Ray (pre-training pictures only) CC BY 4.0
- COVID-19-NY-SBU (pre-training pictures only) CC BY 4.0
- Tuberculosis chest X-ray sets, Kiran and Jabeen (pre-training pictures only) CC BY 4.0
- BDCXR-3257 (pre-training pictures only) CC BY 4.0
Show the numbers
| Result | Metric | Score | 95% interval | Kind | Test set |
|---|---|---|---|---|---|
| Main results | |||||
| Agreement with ChestX-ray14's labels, mean over its 14 label types | AUROC | 0.8175 | 0.8110 to 0.8231 | held-out test | NIH's official test list: 25,596 pictures of 2,797 patients |
| Agreement with ChestX-ray14's abnormal label | AUROC | 0.7363 | 0.7241 to 0.7477 | held-out test | NIH's official test list: 25,596 pictures |
| Agreement with ChestX-ray14's labels, per label type | |||||
| Atelectasis | AUROC | 0.7747 | 0.7622 to 0.7878 | held-out test | NIH's official test list, 25,596 pictures; 3,279 pictures |
| Cardiomegaly | AUROC | 0.9016 | 0.8864 to 0.9142 | held-out test | NIH's official test list, 25,596 pictures; 1,069 pictures |
| Effusion | AUROC | 0.8388 | 0.8282 to 0.8487 | held-out test | NIH's official test list, 25,596 pictures; 4,658 pictures |
| Infiltration | AUROC | 0.7071 | 0.6961 to 0.7175 | held-out test | NIH's official test list, 25,596 pictures; 6,112 pictures |
| Mass | AUROC | 0.8235 | 0.8032 to 0.8424 | held-out test | NIH's official test list, 25,596 pictures; 1,748 pictures |
| Nodule | AUROC | 0.7544 | 0.7333 to 0.7743 | held-out test | NIH's official test list, 25,596 pictures; 1,623 pictures |
| Pneumonia | AUROC | 0.7267 | 0.7021 to 0.7497 | held-out test | NIH's official test list, 25,596 pictures; 555 pictures |
| Pneumothorax | AUROC | 0.8614 | 0.8447 to 0.8773 | held-out test | NIH's official test list, 25,596 pictures; 2,665 pictures |
| Consolidation | AUROC | 0.7610 | 0.7459 to 0.7750 | held-out test | NIH's official test list, 25,596 pictures; 1,815 pictures |
| Edema | AUROC | 0.8542 | 0.8383 to 0.8704 | held-out test | NIH's official test list, 25,596 pictures; 925 pictures |
| Emphysema | AUROC | 0.8960 | 0.8801 to 0.9096 | held-out test | NIH's official test list, 25,596 pictures; 1,093 pictures |
| Fibrosis | AUROC | 0.8382 | 0.8149 to 0.8608 | held-out test | NIH's official test list, 25,596 pictures; 435 pictures |
| Pleural thickening | AUROC | 0.7845 | 0.7661 to 0.8036 | held-out test | NIH's official test list, 25,596 pictures; 1,143 pictures |
| Hernia | AUROC | 0.9232 | 0.8776 to 0.9574 | held-out test | NIH's official test list, 25,596 pictures; 86 pictures |
CT
CT organ outliner
A two-step network trained to label each point of a 3D CT scan as one of 117 organs and bones, such as the liver, spleen, aorta, ribs and vertebrae, or as nothing.
Main results
Dice overlap with the dataset's own outlines, 1 is a perfect match
Score (95% interval)
Held-out test
Mean over 115 structuresHeld-out test: 89 CT scans
0.8668 (0.8538 to 0.8781)
Development
Mean over 115 structures, development scans1,139 development scans, each read by models that never saw it
0.8156 (0.8116 to 0.8194)
Mean Dice by group of scans
Test set: Held-out test: 89 CT scans (a scan can sit in more than one group)
Dice overlap with the dataset's own outlines, 1 is a perfect match
Score (95% interval)
Held-out test
All89 scans
0.8668 (0.8538 to 0.8781)
Abdomen scans47 scans
0.8802 (0.8680 to 0.8914)
Thorax scans32 scans
0.8883 (0.8759 to 0.8986)
Head or neck scans19 scans
0.8766 (0.8554 to 0.8950)
Siemens scanners58 scans
0.8709 (0.8527 to 0.8858)
Other scanner makers31 scans
0.8642 (0.8449 to 0.8815)
The dataset's main institute55 scans
0.8573 (0.8362 to 0.8737)
All other institutes34 scans
0.8866 (0.8733 to 0.8981)
Scans with marked pathology73 scans
0.8663 (0.8514 to 0.8793)
Where it falls short
- Both kidney cysts score 0.0000 on the test scans. Vertebra C6, the gallbladder, the portal and splenic veins and the adrenal glands are the next weakest.
- It outlines a structure that is not in the scan about 4% of the time on the test scans and about 13% of the time on the development scans.
- Most test scans come from one institute and one scanner maker, and the score is lower for that institute (0.8573) than for the others (0.8866).
Trained and tested on
Show the numbers
| Result | Metric | Score | 95% interval | Kind | Test set |
|---|---|---|---|---|---|
| Main results | |||||
| Mean over 115 structures | Dice | 0.8668 | 0.8538 to 0.8781 | held-out test | Held-out test: 89 CT scans |
| Mean over 115 structures, development scans | Dice | 0.8156 | 0.8116 to 0.8194 | development | 1,139 development scans, each read by models that never saw it |
| Mean Dice by group of scans | |||||
| All | Dice | 0.8668 | 0.8538 to 0.8781 | held-out test | Held-out test: 89 CT scans (a scan can sit in more than one group); 89 scans |
| Abdomen scans | Dice | 0.8802 | 0.8680 to 0.8914 | held-out test | Held-out test: 89 CT scans (a scan can sit in more than one group); 47 scans |
| Thorax scans | Dice | 0.8883 | 0.8759 to 0.8986 | held-out test | Held-out test: 89 CT scans (a scan can sit in more than one group); 32 scans |
| Head or neck scans | Dice | 0.8766 | 0.8554 to 0.8950 | held-out test | Held-out test: 89 CT scans (a scan can sit in more than one group); 19 scans |
| Siemens scanners | Dice | 0.8709 | 0.8527 to 0.8858 | held-out test | Held-out test: 89 CT scans (a scan can sit in more than one group); 58 scans |
| Other scanner makers | Dice | 0.8642 | 0.8449 to 0.8815 | held-out test | Held-out test: 89 CT scans (a scan can sit in more than one group); 31 scans |
| The dataset's main institute | Dice | 0.8573 | 0.8362 to 0.8737 | held-out test | Held-out test: 89 CT scans (a scan can sit in more than one group); 55 scans |
| All other institutes | Dice | 0.8866 | 0.8733 to 0.8981 | held-out test | Held-out test: 89 CT scans (a scan can sit in more than one group); 34 scans |
| Scans with marked pathology | Dice | 0.8663 | 0.8514 to 0.8793 | held-out test | Held-out test: 89 CT scans (a scan can sit in more than one group); 73 scans |
MRI
Disc grading research model (MRI)
Three networks trained to give each lower-spine disc on a sagittal MRI a Pfirrmann grade from 1 to 5 and a score for seven wear label types.
Main results
Kappa 0 is chance agreement, 1 is full agreement
Score (95% interval)
Held-out test
Agreement with SPIDER's Pfirrmann grades, held-out testSPIDER held-out test: 44 patients, 264 discs, opened once
0.773 (0.664 to 0.853)
Percent 0 to 100
Score (95% interval)
Development
Share of discs given SPIDER's exact grade, development patientsSPIDER development patients, out of fold: 168 patients, 1,004 discs
59.6% (55.5 to 63.4%)
Agreement with SPIDER's labels, seven label types, earlier version 1
Test set: SPIDER held-out test: 44 patients, 264 discs, opened once
AUROC 0.5 is a coin toss, 1 is perfect
Score (95% interval)
Held-out test
Herniation (per disc)
0.818 (0.710 to 0.912)
Narrowing
0.956 (0.930 to 0.980)
Bulging
0.874 (0.824 to 0.919)
Slipped vertebra
0.887 (0.789 to 0.964)
Upper endplate change
0.817 (0.734 to 0.893)
Lower endplate change
0.850 (0.784 to 0.908)
Any Modic change
0.832 (0.743 to 0.911)
Where it falls short
- The three current versions have not been scored on held-out test patients; their results are development results.
- Herniation is the weak spot: for the dataset's herniation label per patient, the three versions together agree on 53% (38% to 70%) of patients with one and 74% of patients without one.
- A new hospital can cost it most of its skill: version 1 scored kappa 0.42 on a collection it had never seen, against 0.78 for the version trained on that collection's development discs.
Trained and tested on
- SPIDER CC BY 4.0
- LSMA-PQR v2 CC BY 4.0
- Lumbar Spine MRI Dataset v2 CC BY 4.0
- Multi-Disorder Annotations for Lumbar Spine Mid-Sagittal Images v1 CC BY 4.0
Show the numbers
| Result | Metric | Score | 95% interval | Kind | Test set |
|---|---|---|---|---|---|
| Main results | |||||
| Agreement with SPIDER's Pfirrmann grades, held-out test | Kappa | 0.773 | 0.664 to 0.853 | held-out test | SPIDER held-out test: 44 patients, 264 discs, opened once |
| Share of discs given SPIDER's exact grade, development patients | Percent | 59.6% | 55.5 to 63.4 | development | SPIDER development patients, out of fold: 168 patients, 1,004 discs |
| Agreement with SPIDER's labels, seven label types, earlier version 1 | |||||
| Herniation (per disc) | AUROC | 0.818 | 0.710 to 0.912 | held-out test | SPIDER held-out test: 44 patients, 264 discs, opened once |
| Narrowing | AUROC | 0.956 | 0.930 to 0.980 | held-out test | SPIDER held-out test: 44 patients, 264 discs, opened once |
| Bulging | AUROC | 0.874 | 0.824 to 0.919 | held-out test | SPIDER held-out test: 44 patients, 264 discs, opened once |
| Slipped vertebra | AUROC | 0.887 | 0.789 to 0.964 | held-out test | SPIDER held-out test: 44 patients, 264 discs, opened once |
| Upper endplate change | AUROC | 0.817 | 0.734 to 0.893 | held-out test | SPIDER held-out test: 44 patients, 264 discs, opened once |
| Lower endplate change | AUROC | 0.850 | 0.784 to 0.908 | held-out test | SPIDER held-out test: 44 patients, 264 discs, opened once |
| Any Modic change | AUROC | 0.832 | 0.743 to 0.911 | held-out test | SPIDER held-out test: 44 patients, 264 discs, opened once |
X-ray
Fracture research model (X-ray)
Two sets of five small networks trained to match a dataset's fracture labels on one wrist, hand, leg, hip or shoulder X-ray.
Main results
AUROC 0.5 is a coin toss, 1 is perfect
Score (95% interval)
Held-out test
Agreement with GRAZPEDWRI-DX's fracture labels, children's wristsGRAZPEDWRI-DX held-out test: 4,067 pictures of 1,176 patients with a certain label
0.979 (0.974 to 0.984)
Agreement with FracAtlas's fracture labels, mixed bonesFracAtlas held-out test: 798 pictures
0.918 (0.888 to 0.945)
Agreement with GRAZPEDWRI-DX's fracture labels, first visits onlyGRAZPEDWRI-DX held-out test, first visits: 2,172 pictures of 990 patients
0.969 (0.960 to 0.978)
Agreement with FracAtlas's fracture labels, by body part
Test set: FracAtlas held-out test (hand not given with an interval in the card)
AUROC 0.5 is a coin toss, 1 is perfect
Score (95% interval)
Held-out test
Leg445 pictures
0.922 (0.877 to 0.961)
Hip67 pictures
0.933 (0.856 to 0.988)
Shoulder65 pictures
0.692 (0.494 to 0.863)
Where it falls short
- Shoulders are weak: on 65 FracAtlas test pictures the AUROC is 0.692 (0.494 to 0.863), from very few pictures, so the true figure is uncertain.
- Hands raise many false alarms: on 299 FracAtlas hand pictures it agrees with the no-fracture label on 0.645 of them, so roughly a third disagree.
- It learned mostly from children's wrists (16,157 of 19,383 pictures) and started from a network trained on chest X-rays, not bones.
Trained and tested on
- GRAZPEDWRI-DX v2 CC BY 4.0
- FracAtlas v7 CC BY 4.0
- NIH ChestX-ray14 (pre-training only, through the chest X-ray research model) NIH asks for credit; use is unrestricted
Show the numbers
| Result | Metric | Score | 95% interval | Kind | Test set |
|---|---|---|---|---|---|
| Main results | |||||
| Agreement with GRAZPEDWRI-DX's fracture labels, children's wrists | AUROC | 0.979 | 0.974 to 0.984 | held-out test | GRAZPEDWRI-DX held-out test: 4,067 pictures of 1,176 patients with a certain label |
| Agreement with FracAtlas's fracture labels, mixed bones | AUROC | 0.918 | 0.888 to 0.945 | held-out test | FracAtlas held-out test: 798 pictures |
| Agreement with GRAZPEDWRI-DX's fracture labels, first visits only | AUROC | 0.969 | 0.960 to 0.978 | held-out test | GRAZPEDWRI-DX held-out test, first visits: 2,172 pictures of 990 patients |
| Agreement with FracAtlas's fracture labels, by body part | |||||
| Leg | AUROC | 0.922 | 0.877 to 0.961 | held-out test | FracAtlas held-out test (hand not given with an interval in the card); 445 pictures |
| Hip | AUROC | 0.933 | 0.856 to 0.988 | held-out test | FracAtlas held-out test (hand not given with an interval in the card); 67 pictures |
| Shoulder | AUROC | 0.692 | 0.494 to 0.863 | held-out test | FracAtlas held-out test (hand not given with an interval in the card); 65 pictures |
CT
Lung nodule research model (CT)
A chain of 3D networks trained to list places in a chest CT scan that look like small round spots (nodules), plus one network trained on LIDC-IDRI's malignancy ratings of nodules.
Main results
AUROC 0.5 is a coin toss, 1 is perfect
Score (95% interval)
Development
Agreement with LIDC-IDRI's malignancy ratings, per patient117 LIDC patients (86 cancers, 31 benign), out of fold
0.7170 (0.5990 to 0.8270)
Agreement with LIDC-IDRI's malignancy ratings, per nodule749 LIDC nodules, out of fold
0.9485 (0.9300 to 0.9652)
Percent 0 to 100
Score (95% interval)
Development
Share of LUNA16's marked nodules matched, averaged over seven false-alarm allowancesLUNA16: 888 thin-slice LIDC-IDRI scans, five folds, each read by a model that never trained on it
88.0% (86.0 to 89.6%)
Where it falls short
- All the nodule-matching numbers are development scores from the same 888 scans used to choose between designs; there is no untouched test.
- Per patient, the largest nodule's diameter alone scores 0.755, higher than the model's 0.717.
- At one false alarm in eight scans it matches 70.5% of LUNA16's marked nodules under the strict reading.
Trained and tested on
- LIDC-IDRI CC BY 3.0
- LUNA16 (answer key and scoring script) CC BY 4.0
- LIDC-annot-NLST501 CC BY 4.0
- NLST-Sybil (label corrections only) CC BY 4.0
- SPIE-AAPM Lung CT Challenge (LUNGx), practice scans checked only CC BY 3.0
Show the numbers
| Result | Metric | Score | 95% interval | Kind | Test set |
|---|---|---|---|---|---|
| Main results | |||||
| Share of LUNA16's marked nodules matched, averaged over seven false-alarm allowances | Percent | 88.0% | 86.0 to 89.6 | development | LUNA16: 888 thin-slice LIDC-IDRI scans, five folds, each read by a model that never trained on it |
| Agreement with LIDC-IDRI's malignancy ratings, per patient | AUROC | 0.7170 | 0.5990 to 0.8270 | development | 117 LIDC patients (86 cancers, 31 benign), out of fold |
| Agreement with LIDC-IDRI's malignancy ratings, per nodule | AUROC | 0.9485 | 0.9300 to 0.9652 | development | 749 LIDC nodules, out of fold |
Mammogram
Mammogram research model
Five versions of a network trained to match a dataset's benign/malignant labels for a lesion already marked on a mammogram.
Main results
AUROC 0.5 is a coin toss, 1 is perfect
Score (95% interval)
Held-out test
Agreement with CBIS-DDSM's benign/malignant labels, masses, per lesion and viewCBIS-DDSM official test list: 378 masses, opened once
0.8290 (0.7750 to 0.8730)
Development
Agreement with CMMD's benign/malignant labels, per pictureCMMD: 3,744 pictures of 1,775 patients, five folds split by patient
0.7930 (0.7740 to 0.8110)
Agreement with CMMD's benign/malignant labels, per breastCMMD: 1,872 breasts, five folds split by patient
0.8147 (0.7945 to 0.8346)
Where it falls short
- Masses are the weak spot: they score 0.7371 against 0.8424 for calcifications, and masses are 2,298 of the 3,744 pictures.
- Where no lesion outline exists the score is close to a coin toss: version 38 scores 0.5726 on those 1,002 pictures.
- Every CMMD number comes from CMMD itself. There is no held-out test and no second hospital, so the figure may be a little high for new pictures.
Trained and tested on
- CMMD CC BY 4.0
- TOMPEI-CMMD (lesion outlines, training only) CC BY 4.0
- CBIS-DDSM CC BY 3.0
- OMAMA-DB MIT
- NIH ChestX-ray14 (start of the training chain) NIH asks for credit; use is unrestricted
Show the numbers
| Result | Metric | Score | 95% interval | Kind | Test set |
|---|---|---|---|---|---|
| Main results | |||||
| Agreement with CMMD's benign/malignant labels, per picture | AUROC | 0.7930 | 0.7740 to 0.8110 | development | CMMD: 3,744 pictures of 1,775 patients, five folds split by patient |
| Agreement with CMMD's benign/malignant labels, per breast | AUROC | 0.8147 | 0.7945 to 0.8346 | development | CMMD: 1,872 breasts, five folds split by patient |
| Agreement with CBIS-DDSM's benign/malignant labels, masses, per lesion and view | AUROC | 0.8290 | 0.7750 to 0.8730 | held-out test | CBIS-DDSM official test list: 378 masses, opened once |
X-ray
Lumbar spine X-ray corner reader
Small networks trained to place the corners of the lower-back vertebrae L1 to L5 on a spine X-ray, one for the side view and one for the front view.
Main results
Percent 0 to 100
Score (95% interval)
Held-out test
Share of the second set's marked corners within 5 pixels, side viewOutside set: 590 side-view pictures from the Spondylolisthesis Vertebral Landmark set, no network trained on it, scored once
64.3% (61.7 to 66.9%)
Development
Share of BUU-LSPINE's marked vertebrae matched, side view (IoU 0.5)All 2,000 BUU-LSPINE patients, out of fold
97.9% (97.3 to 98.4%)
Share of BUU-LSPINE's marked vertebrae matched, front view (IoU 0.5)All 2,000 BUU-LSPINE patients, out of fold
95.8% (95.0 to 96.6%)
Share of BUU-LSPINE's marked vertebrae matched, development patients
Test set: All 2,000 BUU-LSPINE patients, out of fold
Percent 0 to 100
Score (95% interval)
Development
Side view, IoU 0.52,000 patients
97.9% (97.3 to 98.4%)
Side view, stricter reading (0.50 to 0.95)2,000 patients
89.4% (88.8 to 89.9%)
Front view, IoU 0.52,000 patients
95.8% (95.0 to 96.6%)
Front view, stricter reading (0.50 to 0.95)2,000 patients
81.2% (80.4 to 81.9%)
Where it falls short
- On the second set it places 64.3% of corners within 5 pixels; the pictures of the Burapha patients score 71.6% and those of the Honduran patients score 18.3%.
- Everything it learned from comes from one dataset collected in Thailand.
- The average miss is bigger than the typical miss: on the side view 11.78 pixels against a median patient of 7.10.
Trained and tested on
- BUU-LSPINE, 2,000-patient release (Burapha University, Thailand) Burapha University End-User License Agreement, accepted before download
- Spondylolisthesis Vertebral Landmark Dataset v1 (testing only) CC BY 4.0
Show the numbers
| Result | Metric | Score | 95% interval | Kind | Test set |
|---|---|---|---|---|---|
| Main results | |||||
| Share of BUU-LSPINE's marked vertebrae matched, side view (IoU 0.5) | Percent | 97.9% | 97.3 to 98.4 | development | All 2,000 BUU-LSPINE patients, out of fold |
| Share of BUU-LSPINE's marked vertebrae matched, front view (IoU 0.5) | Percent | 95.8% | 95.0 to 96.6 | development | All 2,000 BUU-LSPINE patients, out of fold |
| Share of the second set's marked corners within 5 pixels, side view | Percent | 64.3% | 61.7 to 66.9 | held-out test | Outside set: 590 side-view pictures from the Spondylolisthesis Vertebral Landmark set, no network trained on it, scored once |
| Share of BUU-LSPINE's marked vertebrae matched, development patients | |||||
| Side view, IoU 0.5 | Percent | 97.9% | 97.3 to 98.4 | development | All 2,000 BUU-LSPINE patients, out of fold; 2,000 patients |
| Side view, stricter reading (0.50 to 0.95) | Percent | 89.4% | 88.8 to 89.9 | development | All 2,000 BUU-LSPINE patients, out of fold; 2,000 patients |
| Front view, IoU 0.5 | Percent | 95.8% | 95.0 to 96.6 | development | All 2,000 BUU-LSPINE patients, out of fold; 2,000 patients |
| Front view, stricter reading (0.50 to 0.95) | Percent | 81.2% | 80.4 to 81.9 | development | All 2,000 BUU-LSPINE patients, out of fold; 2,000 patients |